Transforming UB’s digital communications.
Finding Your Top Pages
During Step 1 of your NextGen conversion, you'll identify strategic pages to review throughout the conversion process. This Looker Studio tool provides a simplified interface to Google Analytics data, making it easy to identify your most-visited pages.
On This Page
Access the Tool
This Looker Studio report provides the same GA4 data in a simpler interface. If you prefer working directly in GA4, you're welcome to use that instead.
Report Unavailable?
If the UB site analytics tool won't load due to high traffic, try this alternate copy of the tool. It has the same data and features. > Open the alternate analytics tool
Setting Up Your Filters
The tool shows data for all UB sites by default. Use these three filters to narrow down to just your site:
1. Date Range
Select your date range using the date picker drop down. Default is the last 28 days, which works well for most sites. For seasonal sites or sites with less traffic, you may want to expand to 60 or 90 days, or even a full year for better data.
2. Hostname
Choose your hostname carefully:
- If your site is www.buffalo.edu/yoursite, select "www.buffalo.edu" only
- If your site is yoursite.buffalo.edu, select "yoursite.buffalo.edu" only
Important: Only select your specific hostname. Don't select multiple or your results can be mixed with other sites.

3. Page Path
This filter narrows results to just your site's pages.
Choose your condition:
- EQUALS - Exact path match (used to view one specific page)
- CONTAINS - Path includes this text (use cautiously - may pick up other sites)
- STARTS WITH - Path begins with this text (recommended)
- REGEX - Advanced pattern matching
- IN - List of specific paths
Recommended approach: Use "STARTS WITH" and enter your site path.

Filter Examples
Here are the most common setups. Follow the pattern that matches your site:
Example 1: Site under www.buffalo.edu
Site: www.buffalo.edu/admissions
- Hostname: www.buffalo.edu
- Page path: starts with /admissions/

Example 2: School with its own hostname
Site: arts-sciences.buffalo.edu
- Hostname: arts-sciences.buffalo.edu
- Page path: starts with /
- Note: This returns all pages on this hostname, including department sites

Example 3: Department within a school
Site: arts-sciences.buffalo.edu/music
- Hostname: arts-sciences.buffalo.edu
- Page path: starts with /music/
- Note: Always use the trailing slash (e.g., /music/ not /music) to avoid partial matches like /musictherapy/

Understanding the Results
Once your filters are set, you'll see your site's pages with engagement metrics. The tool has two views:
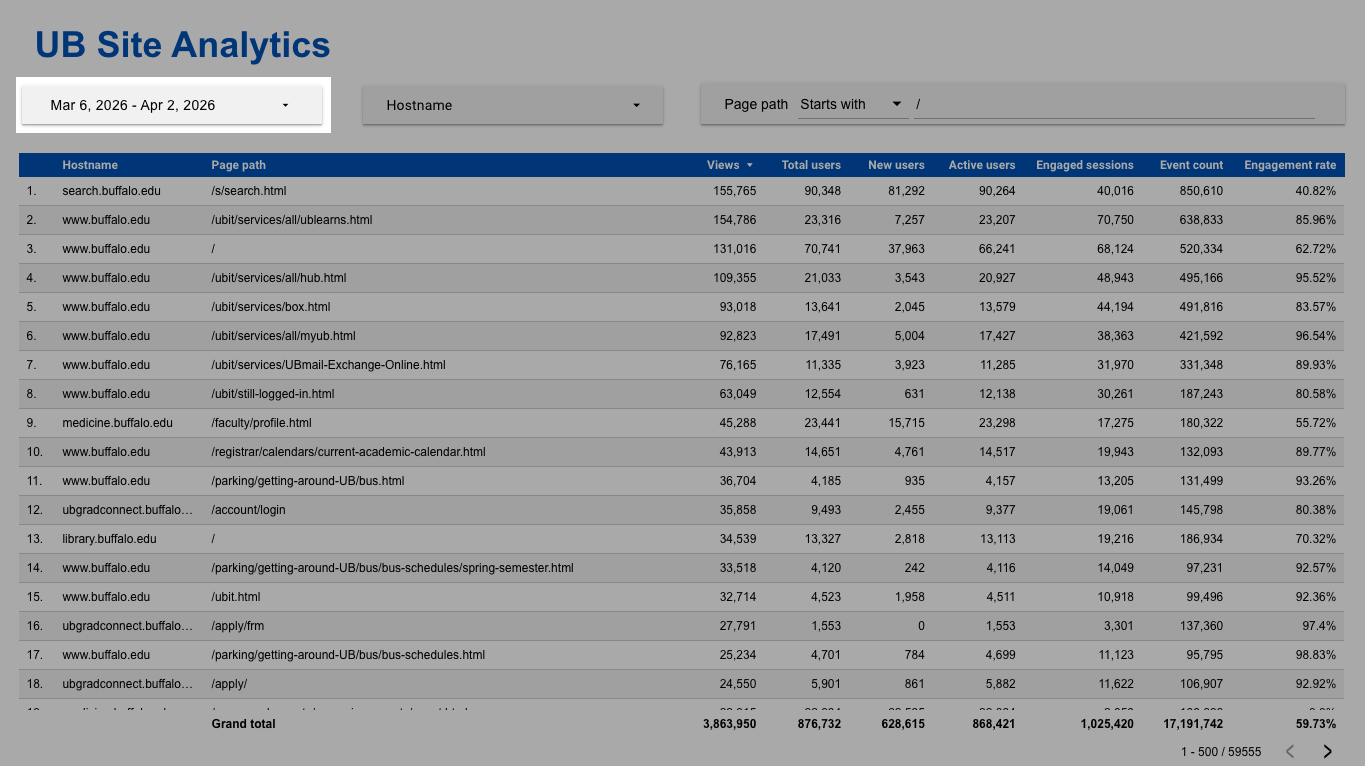
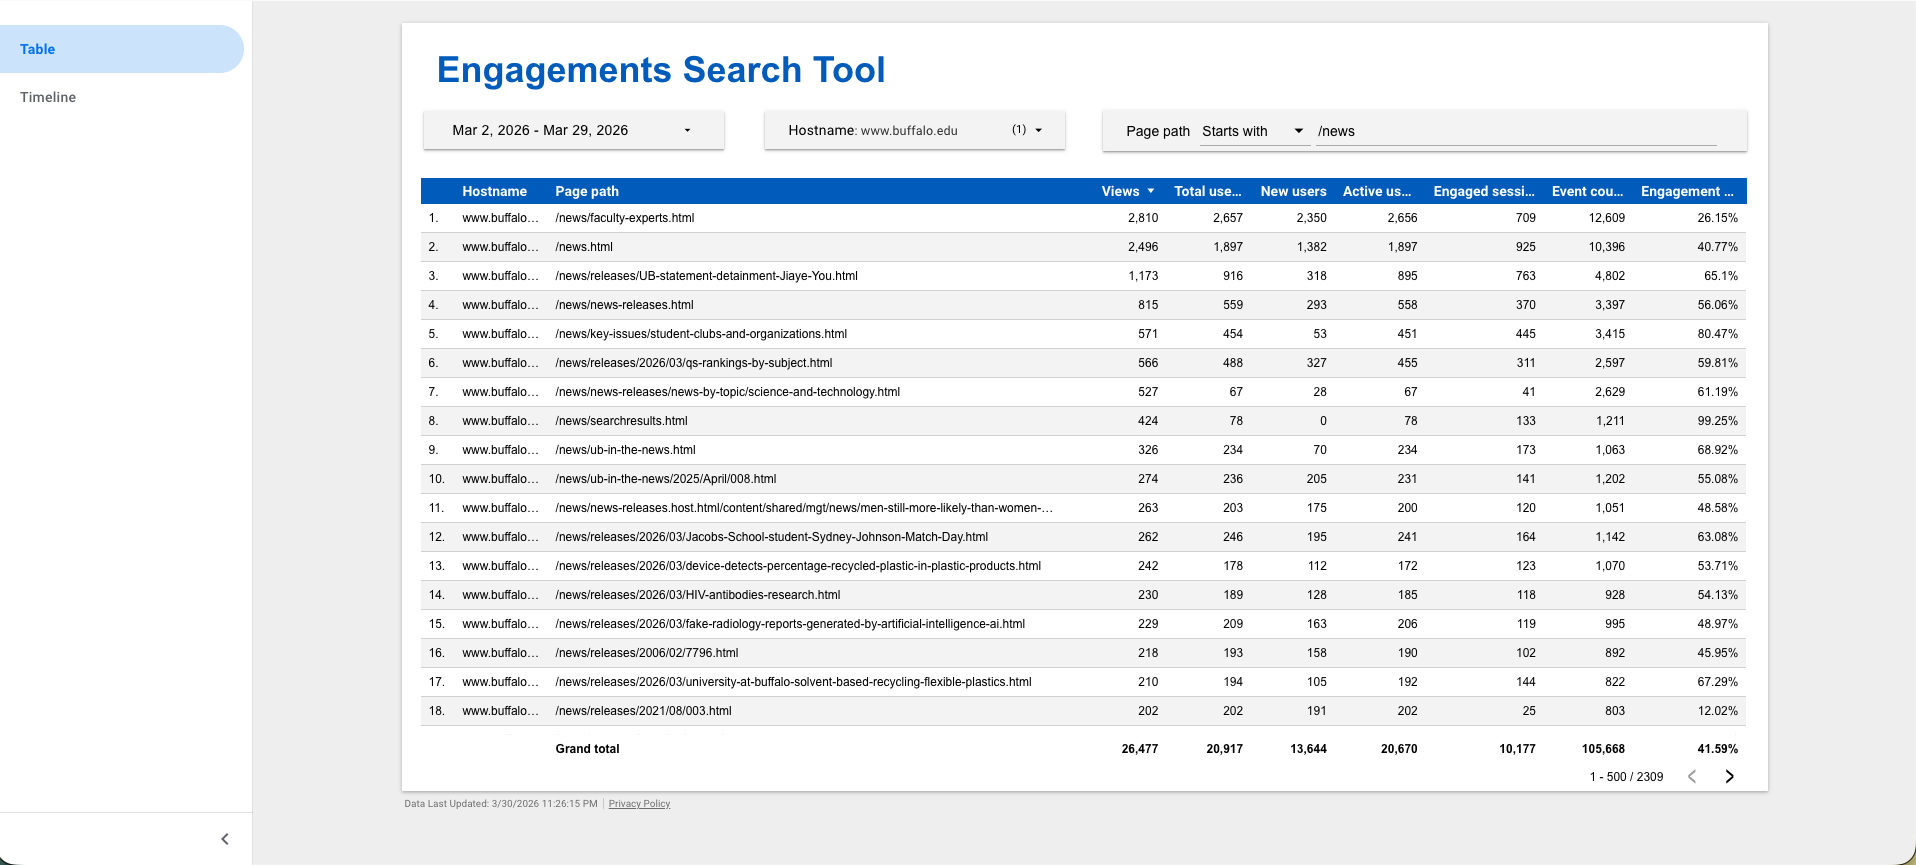
1. Table View
Shows a list of all matching pages with these metrics:
- Views - Total page views (default sort, descending)
- Total Users - All users who viewed the page
- New Users - First-time visitors
- Active Users - Users who engaged with content
- Engaged Sessions - Sessions with meaningful interaction
- Event Count - Total tracked events
- Engagement Rate - Percentage of engaged sessions
Tips:
- Click any column header to sort ascending or descending.
- Sort by Views (descending) to see your most-visited pages at the top.
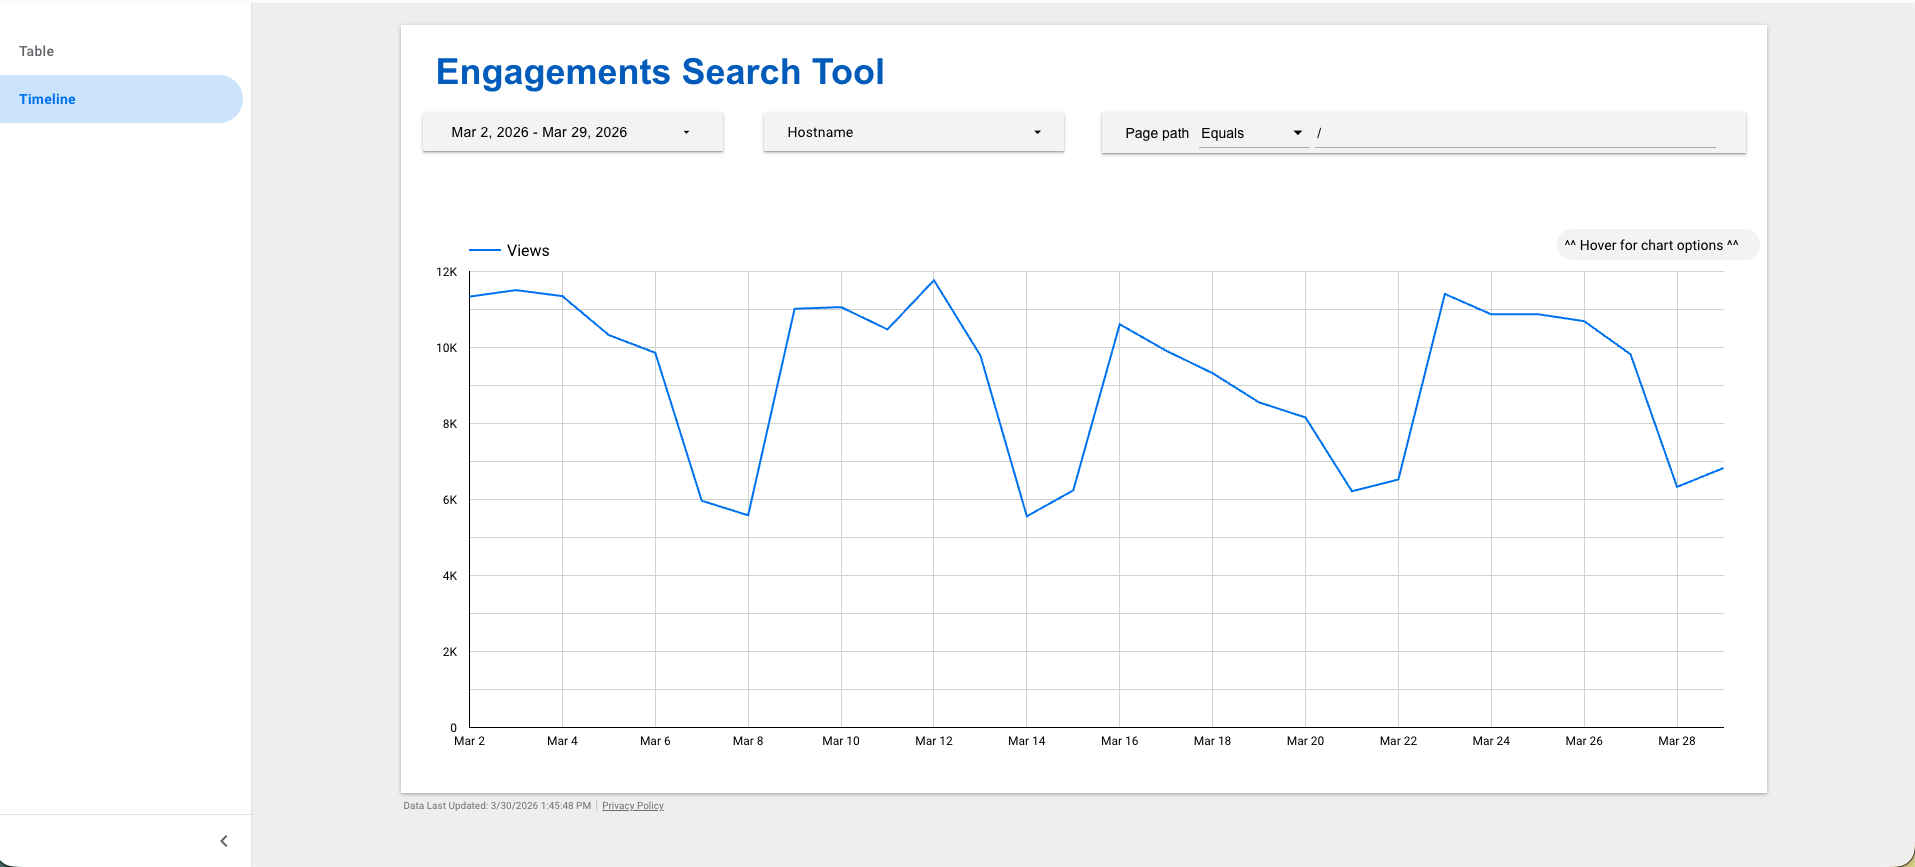
2. Timeline View
Shows traffic trends over your selected date range. The Views metric displays by default.
To view additional metrics: Hover over the chart to reveal the optional metrics menu. Check the boxes for metrics you want to plot on the timeline.
Useful for: Understanding traffic patterns, identifying seasonal trends, spotting unusual spikes or drops.
Identifying Your Top Pages
With your filters set and the table sorted by Views (descending):
- Look for significant drop-offs in the Views column
- Pages above the drop-off are your highest-traffic pages
- Add these to your strategic review list for Step 2
Example: If your top 5 pages have 2,000-5,000 views, but page 6 drops to 300 views, focus on those top 5.
Questions or feedback?
Have a question about the conversion process or the resources on this site? Want to share feedback on how we can improve?